Intellect™
SAMPLE MANAGEMENT ANALYSIS REPORTS

Please note the following:
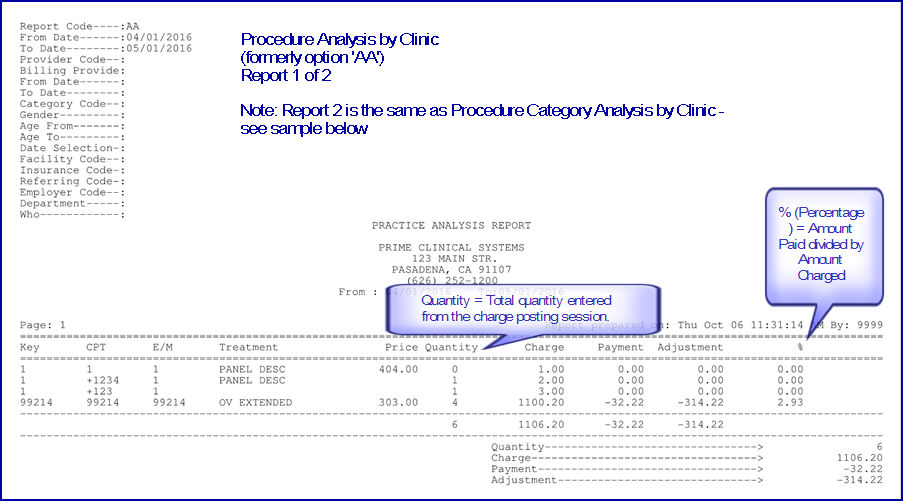
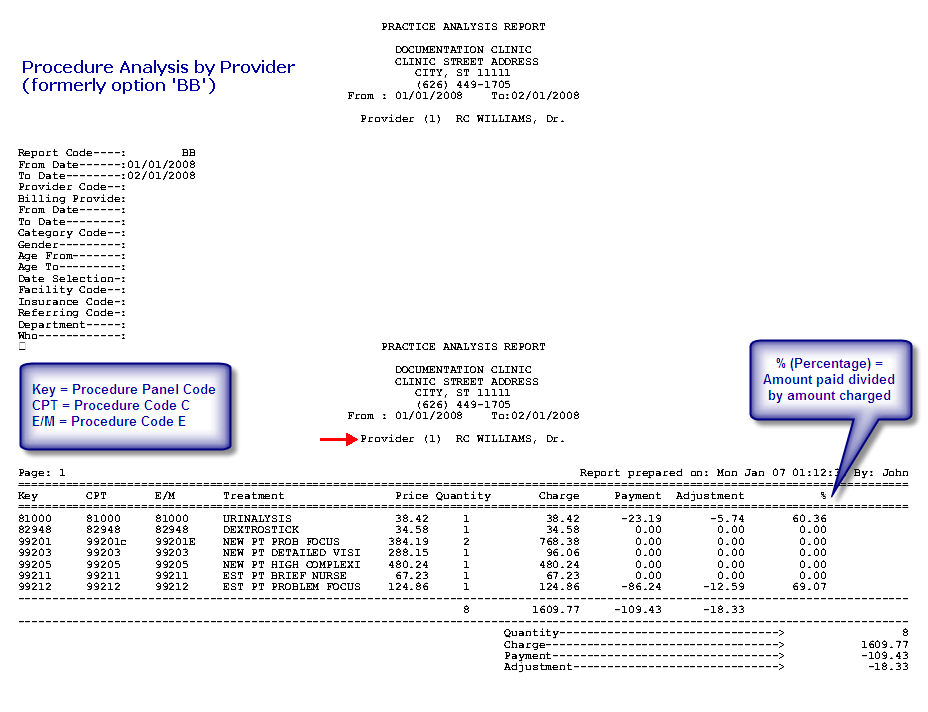
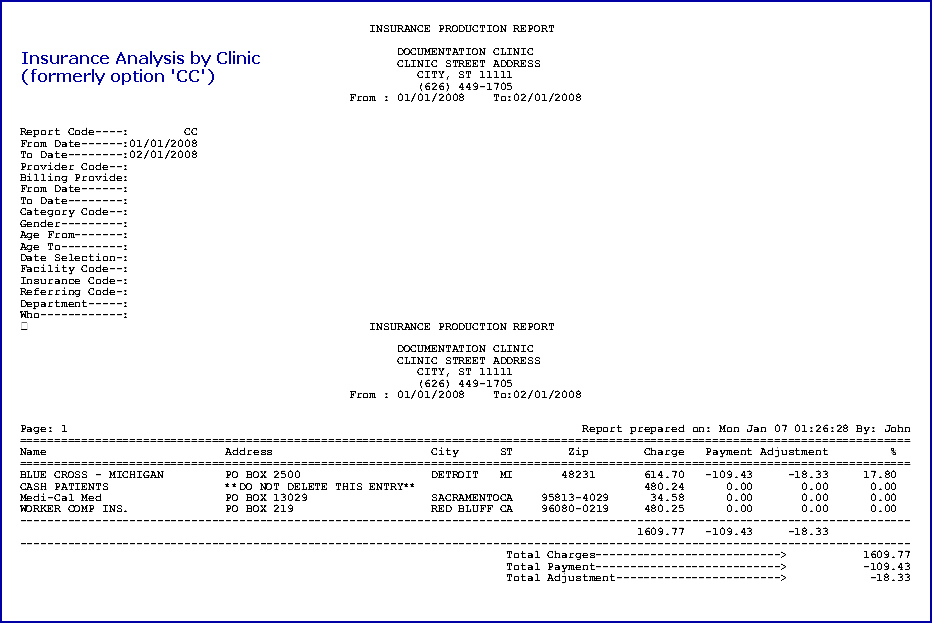
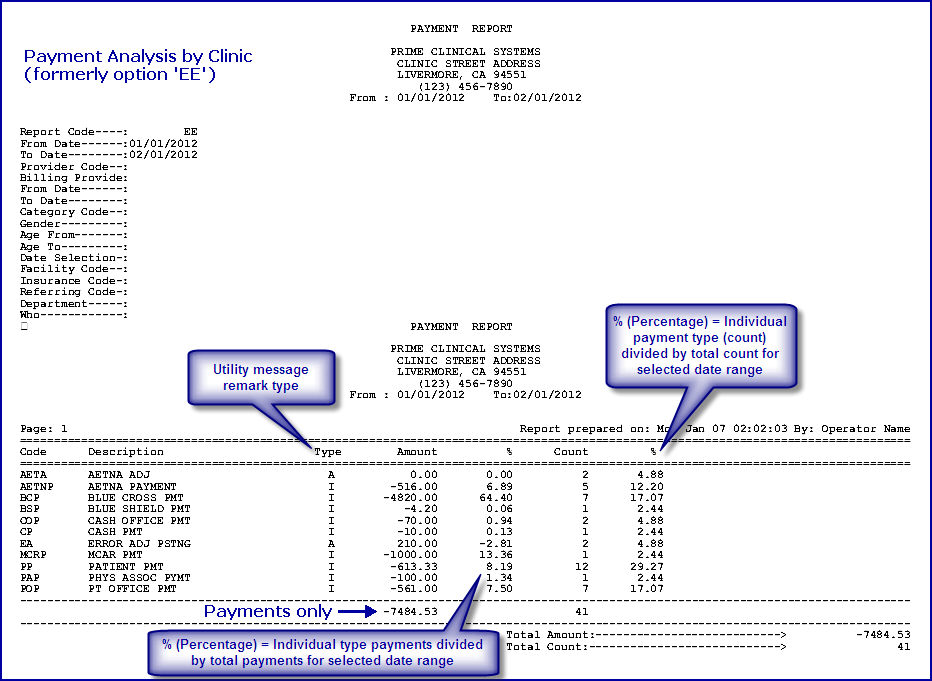
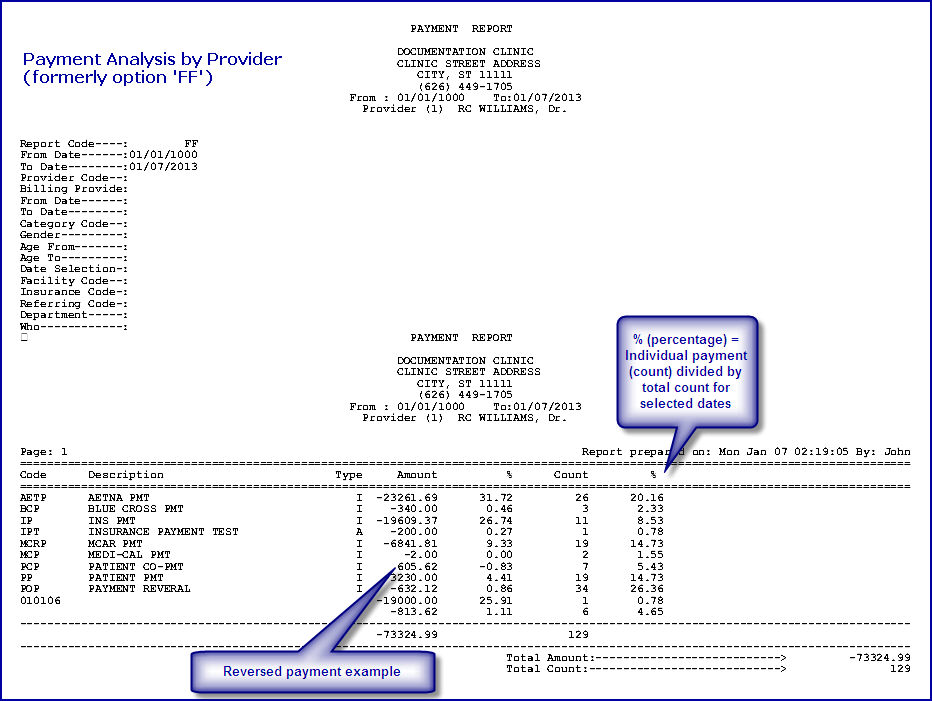
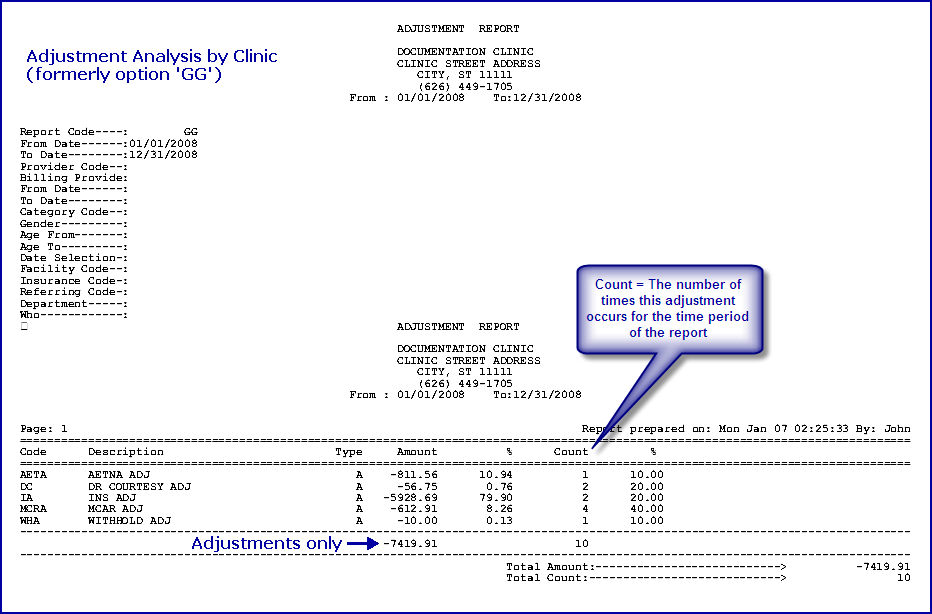
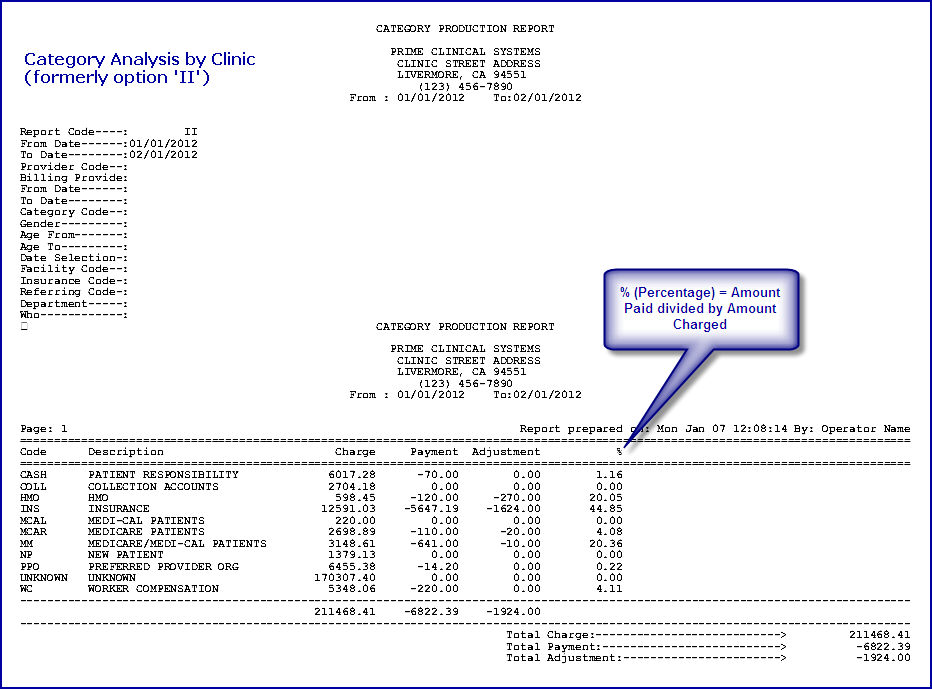
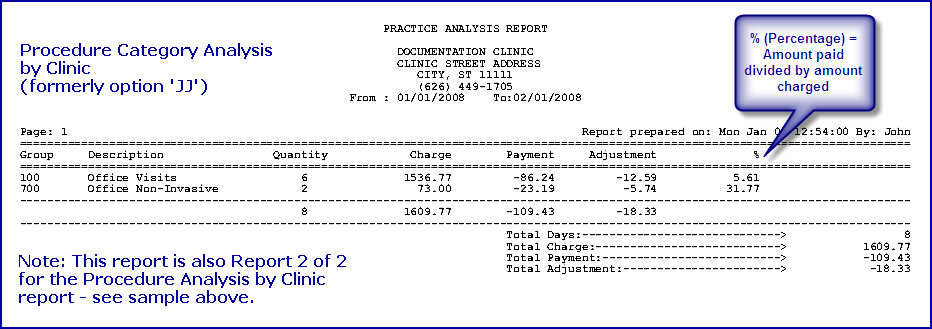
• The % column represents the amount paid divided by the amount charged, unless indicated otherwise.
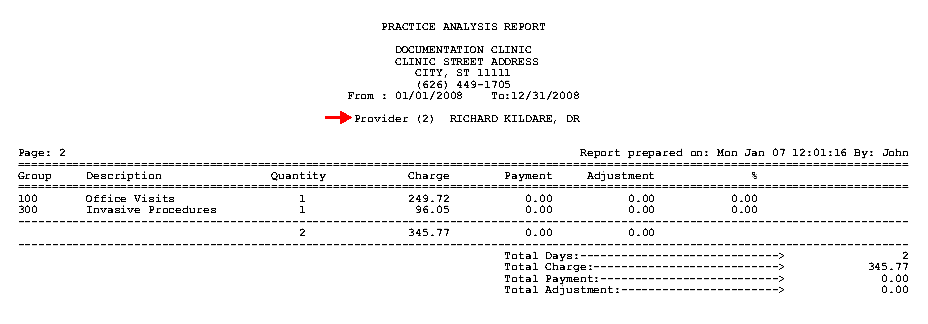
• For reports such as the Practice Analysis reports, 'Quantity' summarizes the amount indicated in the <QTY> field on the Charge screen per reported item. For example:
| Qty for 1 date of service (DOS) | = 10 |
| Qty for 2 DOS | = 1 |
| Sum of QTY | = 11 |
Scroll through the report samples (in order by the <Report Code> drop-down list), OR click on the alphabetized report titles below:
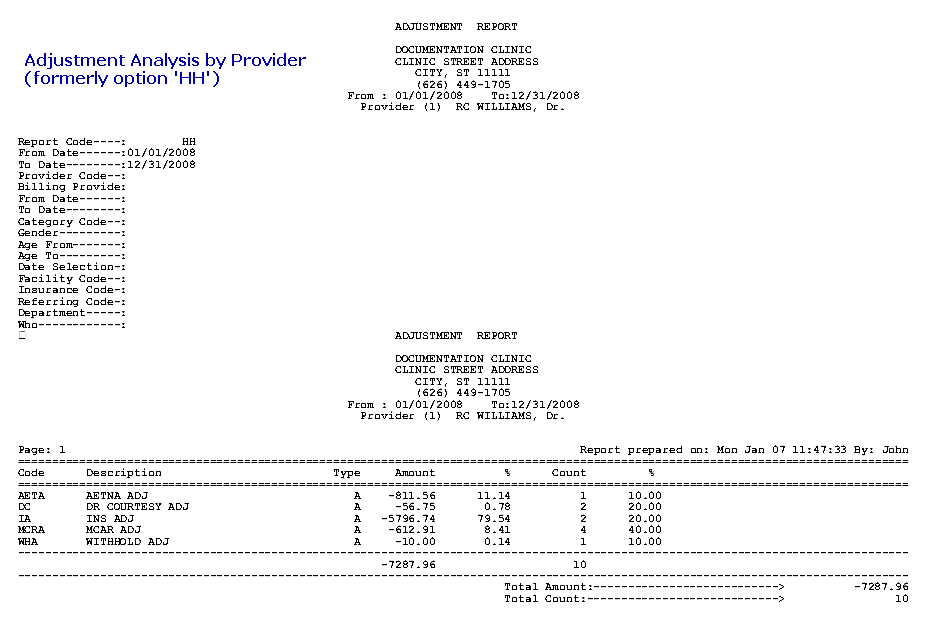
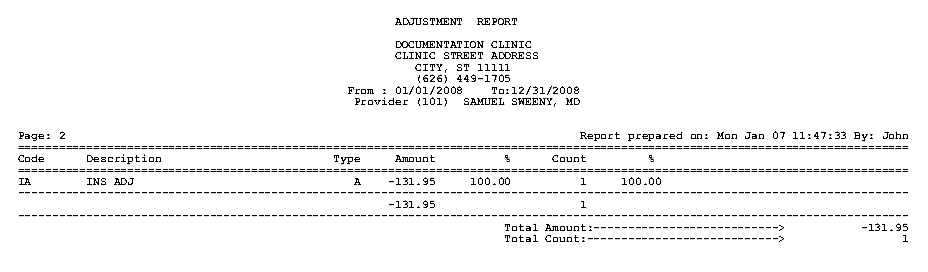
Adjustment Analysis by Provider
Procedure Analysis by Provider
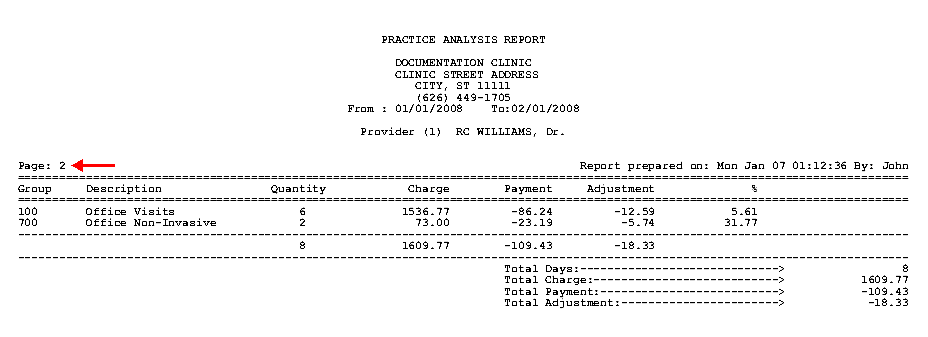
Procedure Category Analysis by Clinic
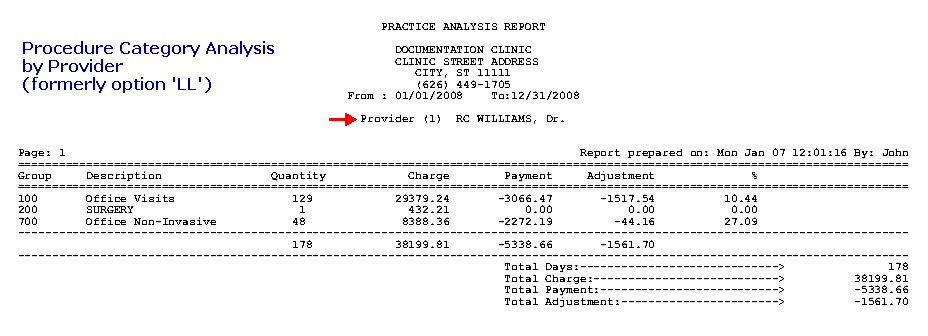
Procedure Category Analysis by Provider
For information on requesting reports and selecting/filtering data, see:
• Management --►Analysis--►Analysis Report
• Management --►Analysis--►Analysis Report - Field Summary